SYSTAT® supports all types of scientific and technical research applications. SYSTAT is not limited to only the following sample applications shown below.
Sample Applications :
Archeology:
Evolution of Skull Dimensions
SYSTAT®‘s MANOVA procedure found significant variation between time periods in these measurements of male Egyptian skulls. The multivariate results are corroborated by the univariate ANOVA depicted here in these combined Regression/Box Plots.
Environmental Sciences:
TCE Contamination
These survival plots show the effect of four levels of TCE contamination on Vallisneria Americana. The plots clearly show that higher levels of TCE reduce the survival rate across all genders.
Epidemiology
Tuberculosis Incidents
SYSTAT® lets you combine geographic and statistical data to create insightful maps. This plot uses color coding to highlight high incidence rates of tuberculosis across Europe.
Geology:
Estimation of Uranium Reserves from Groundwater
Potential Uranium reserves are modeled using SYSTAT®‘s spatial statistics Kriging estimator. This Krig contour overlaid with actual Uranium levels indicates that the largest concentration is located in the area near longitude:101; latitude: 33.4.
Manufacturing:
Quality Improvement
SYSTAT® helps keep track of your manufacturing process. Here, an X-bar QuickGraph shows the average resistance of five randomly selected computer components measured over twenty production days. The X-bar shows the components well within control limits.
Medical Research:
Clinical Trials
Repeated measures ANOVA was used here to investigate the effects of four different drug treatments on blood histamine levels in dogs.
Psychology:
Instructional Methods and Learning
Analysis of Covariance (ANCOVA) was necessary to adjust for the effect of basic aptitude in this experiment comparing the effectiveness of two different instructional methods.
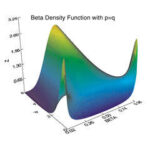
Statistics:
Theoretical Distributions
Compare theory to experiment with SYSTAT®‘s built-in statistical functions, such as this beta density. SYSTAT® offers density, cumulative, inverse and random number functions for 13 distributions.